Alarms#
Alarms notify engineers when something goes wrong. They add alerting on top of the observability stack. Alarms have 2 states, OK and ALARM. In the ALARM state, the alarm can take a notification action.
Email. This is not recommended. The inbox is a cluttered place where emails are easily missed.
Ticket. For low severity issues, this is the preferred notification channel. Tickets go into a dedicated ticket queue solely for the purpose of notifying engineers of operational issues.
Page. A pager is a device or, more commonly now, a phone app that engineers carry while on-call. When the pager receives a page, it makes a loud sound to notify on-call. This ensures the on-call engineer responds immediately. Reserve pages only for high severity, urgent issues.
For urgent and impactful issues, alarms should page the engineers to ensure an immediate response. To catch issues before they become urgent, add more sensitive, ticketing alarms. Because the ticket action is less intrusive, false positives (false alarms) are tolerable, allowing the greater sensitivity.
Alarms can also take actions that are not notifications. A common cause of outages are bad changes. Canaries[1] are a special type of alarm that automatically rolls back changes. Even in the best case, it takes time for a human to be paged, identify the bad change, and roll it back. A canary accelerates this process, reducing the outage duration.
Alarm Rule#
The alarm rule is a Boolean statement that, when true, triggers the alarm by moving it into the ALARM state. When the alarm rule is False, the alarm moves back into OK. Below is the state machine diagram of an alarm.
Alarm rules are almost always a function of a metric. Unlike the remaining observability signals (logs, distributed traces, or profiles), metrics tend to measure one thing which makes for more precise alarms. An alarm with the alarm rule failed_request metric > 5 is more precise than an alarm with the alarm rule number of ERROR logs > 5. Most systems are instrumented such that there is only 1 line which emits the failed_request metric but many lines which emit ERROR logs.
Alarms use a sliding window to convert metrics into true/false[2].
- Threshold \(t\)
The threshold against which the metric will be compared. The threshold should relate to your SLAs. For example, if the SLA for latency is 2 seconds for 99.9% of requests, the alarm should trigger when the p99.9 latency metric exceeds 2 seconds.
- Comparison operator (\(<, >, \leq, \geq, =, \neq\))
A Boolean function which compares a metric value with the threshold. If the function evaluates to true, the metric value breaches the threshold.
- Evaluation periods \(e\)
The number of previous data points to examine.
- Datapoints to alarm \(d\)
The number of consecutive breaching metric values out of \(e\) required to trigger the alarm. Note that this means \(d \leq e\) always.[3]
Increasing \(d\) lowers the sensitivity of the alarm to short breaches which may be random variation. For example, a file upload service might have high latency for large files. If, for whatever reason, the traffic consists of mostly large file uploads, the latency metric will spike even for a healthy service.
The alarm rule is true when the last \(d\) out of \(e\) datapoints–the sliding window–breach \(t\).
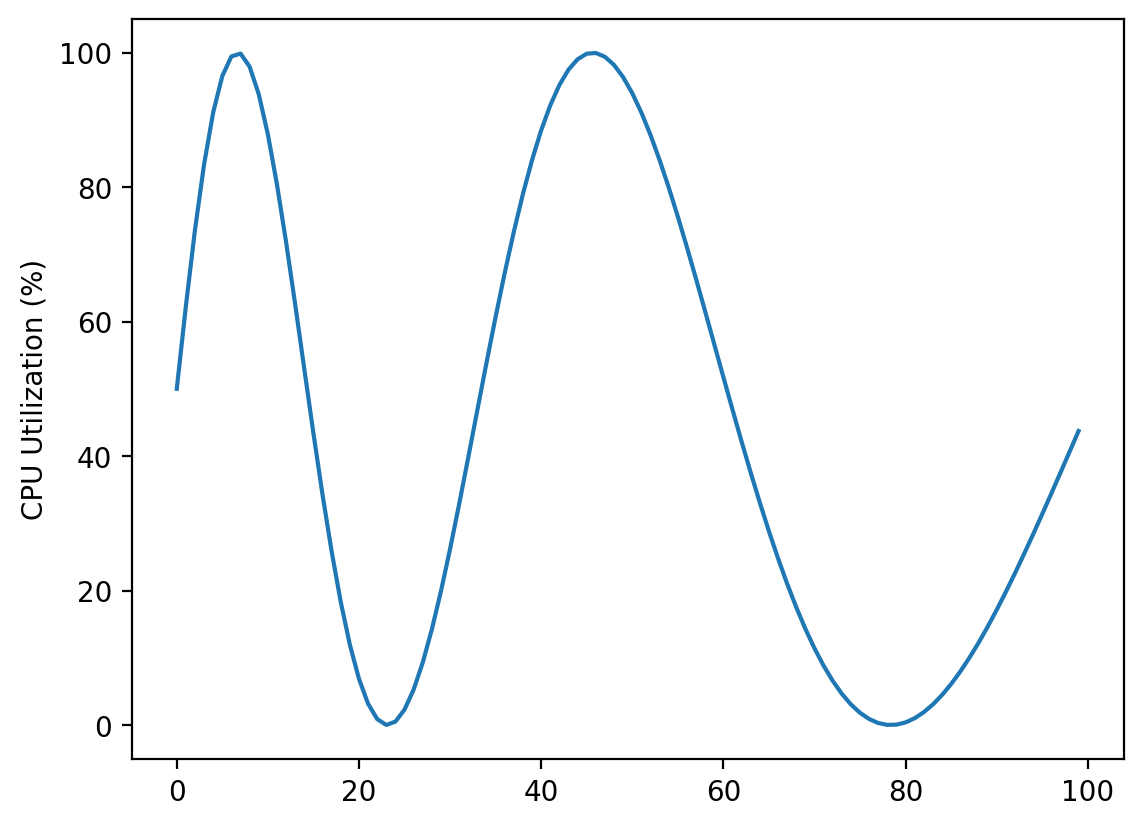
Consider a CPU utilization metric which follows a cyclical pattern. The time period of the cycle increases from 25 to 50 minutes over a 100 minute timespan.
%config InlineBackend.figure_format = 'retina'
import matplotlib.pyplot as plt
import numpy as np

x = np.arange(0, 100)
period = np.linspace(25, 50, 100)
metric = 50 * np.sin(2 * np.pi * x / period) + 50
metric_length = metric.shape[0]

plt.plot(metric)
plt.ylabel('CPU Utilization (%)')
Text(0, 0.5, 'CPU Utilization (%)')
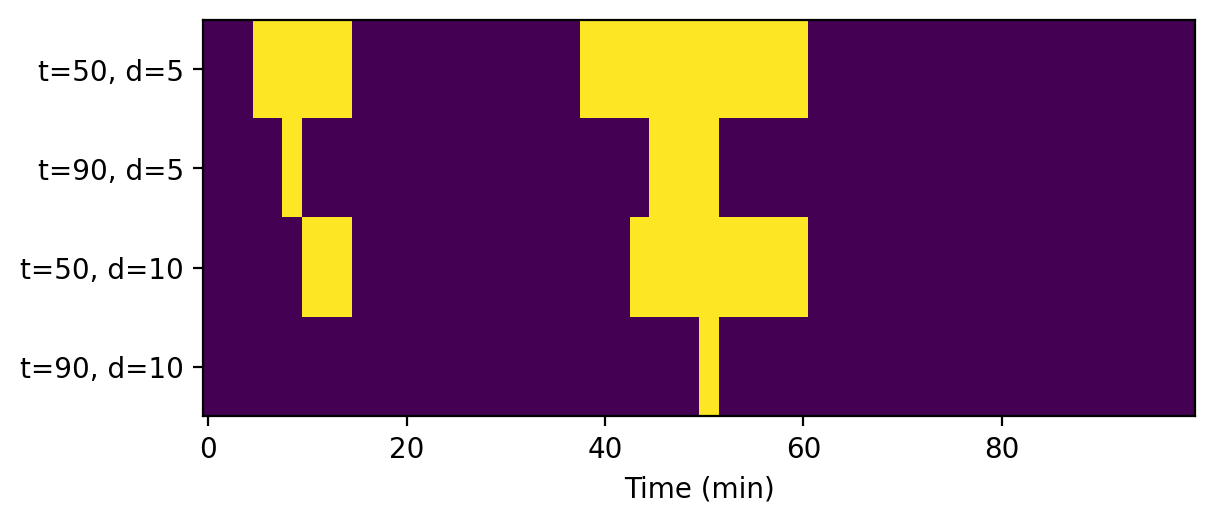
We apply 4 different alarm rules to the CPU utilization metric that check if the CPU is overexerted. The alarm rules are every combination of \(t = 50\%, 90\%\) and \(d = e = 5, 10\).
Table 1. Example alarm rules.
Threshold = 50% |
Threshold = 90% |
|
|---|---|---|
Datapoints_to_alarm = 5 |
Trigger the alarm if the CPU utilization is above 50% for 5 consecutive minutes. |
Trigger the alarm if the CPU utilization is above 90% for 5 consecutive minutes. |
Datapoints_to_alarm = 10 |
Trigger the alarm if the CPU utilization is above 50% for 10 consecutive minutes. |
Trigger the alarm if the CPU utilization is above 90% for 10 consecutive minutes. |
The yellow minutes are when the alarm is triggered.
def alarmRule(metric, threshold, datapoints_to_alarm):
    windows = np.lib.stride_tricks.sliding_window_view(metric, datapoints_to_alarm)
    n_windows = windows.shape[0]
    initial_ok = np.zeros(metric_length - n_windows)
    alarm_state = np.all(windows > threshold, axis=1)
    return np.concatenate([initial_ok, alarm_state], axis=0)


plt.imshow(np.stack([
    alarmRule(metric, 50, 5),
    alarmRule(metric, 90, 5),
    alarmRule(metric, 50, 10),
    alarmRule(metric, 90, 10)
]), aspect=10)
plt.xlabel('Time (min)')
labels = ['t=50, d=5', 't=90, d=5', 't=50, d=10', 't=90, d=10']
plt.yticks(np.arange(len(labels)), labels)
([<matplotlib.axis.YTick at 0x7fead426b590>,
  <matplotlib.axis.YTick at 0x7fead4261010>,
  <matplotlib.axis.YTick at 0x7feaf9c9eed0>,
  <matplotlib.axis.YTick at 0x7fead4291f90>],
 [Text(0, 0, 't=50, d=5'),
  Text(0, 1, 't=90, d=5'),
  Text(0, 2, 't=50, d=10'),
  Text(0, 3, 't=90, d=10')])
Missing Metrics#
So far, we have assumed that there will be a datapoint for every period. However, this will not be true for many systems. For example, a daily batch job can only emit metrics at most once a day. Even for systems serving continuous traffic, metrics may be emitted upon rare events. Missing metrics can be treated in 4 ways.
- Breaching
A missing metric is considered to be above the threshold. For metrics that are expected to continuously report data, the breaching behavior makes sense. For example, resource metrics like memory utilization should publish every \(n\) minutes. The breaching behavior ensures the alarm triggers when there is issue publishing the metric.
- Not breaching
A missing metric is considered to be below the threshold. For metrics that are expected to be rare, the not breaching behavior makes sense. For examples, failure or error metrics are emitted when there are failures or errors. The lack of a failure likely means the issue has disappeared.
- Ignore
Missing metrics cannot affect the alarm state. If the alarm is OK, it will stay in OK. But if the alarm is in ALARM, it will stay in ALARM until enough below-threshold data points arrive.
- Missing
The alarm has a third state INSUFFICIENT_DATA or MISSING_DATA that it enters after \(d\) periods without metric data.
Composite Alarms#
Composite alarms are triggered by other alarms. The alarm rule of a composite alarm includes other alarms. The status of dependency alarms are combined using logical operators. Most alarming systems support logical and, logical or, and negation (denoted \(\land, \lor, \neg\)) but some also support the quantifiers for all and there exists for convenience working with lists of alarms (denoted \(\forall, \exists\)).
Composite alarms allow us to structure alarms as a hierarchy. Have master composite alarms be triggered by alarms on individual metrics. Only the master alarm takes an action. Thus, when an issue causes multiple metrics to cross thresholds, multiple alarms will be triggered. However, since these alarms roll up to a single master alarm, the alarm action is taken exactly once. This avoids duplicate pages/tickets for a single issue.
Engineers don’t lose visibility into the specific alarms. Most alarming system will show the state of dependency alarms when viewing the composite alarm. Engineers can check the master alarm to find the specific alarms and the metrics that are breaching.
Below is an example set of alarms for a key-value store like Redis with 2 APIs: putKeyValuePair and getValue. The alarm rule of the master failure alarm is
The alarm rule of the master latency alarm is
Instrumentation#
Alarms are essential infrastructure. Thus, the principle of Infrastructure as Code (IaC) implies that alarms should be defined in code using a package, library, or SDK. If you are using a cloud based monitoring system, use the same IaC framework to build your alarms. If you cannot use IaC, try to fall back on defining the alarms in a configuration file.